
GGR y NGR son dos indicadores clave de ingresos que todo operador de casino debe monitorear. GGR es el total de apuestas menos los pagos a los jugadores, lo que refleja el rendimiento del juego antes de cualquier deducción. NGR es el GGR después de deducir bonos, impuestos, comisiones, regalías de proveedores y contracargos. La diferencia entre ambos revela dónde se está generando presión sobre los márgenes.

Tu casino registra $60,000 en ingresos brutos del juego (GGR) durante el mes, pero sus ingresos netos del casino (NGR) podrían ser $25,000 menores una vez que se deduzcan los bonos, los impuestos sobre el juego, las comisiones por pago, las devoluciones de cargo, las contribuciones al premio mayor y los costos de los proveedores.
El GGR es una métrica clave, pero no muestra de qué recursos dispone la empresa para cubrir los costes operativos o generar beneficios. Los juegos de azar comerciales en EE. UU. generaron 78.72 millones de dólares en ingresos brutos del juego en 2025., sin embargo que Indicadores clave de rendimiento (KPI) del casino Por sí solo, el análisis de datos no refleja la rentabilidad del operador. Este artículo explica el significado de cada indicador, cómo calcularlos y qué podría indicar una brecha cada vez mayor entre ambos.
¿Qué son los GGR (Ingresos Brutos del Juego)?
El GGR (Ingreso Bruto Ganado) es la cantidad que un casino retiene después de pagar las ganancias de los jugadores. Si los jugadores apuestan colectivamente $1,000,000 y se llevan $940,000 en premios, el operador se queda con $60,000. Esos $60,000 constituyen el GGR.
| Métrico | Cantidad |
| Apuestas totales | €1,000,000 |
| Pagos a los jugadores | €940,000 |
| GGR | €60,000 |
Es la medida estándar del rendimiento de los juegos, no una medida de ganancias. El GGR indica cuánto ganó el juego, no cuánto ganó la empresa.
El cálculo solo tiene en cuenta dos cosas: el total de apuestas realizadas por los jugadores y el total de pagos a los jugadores restados de esas apuestas. Todo lo demás queda fuera del GGR. Los siguientes costos no se deducen en esta etapa:
- Costes adicionales.
- Tarifas de procesamiento de pagos.
- Comisiones de afiliados.
- Honorarios y regalías de los proveedores.
- Impuestos y costos de licencia.
- Contracargos
Todos esos datos se desglosan posteriormente, ya sea en la fase NGR o más adelante en el estado de resultados. Precisamente esa separación es lo que hace útil al GGR. Al eliminar las estructuras de costos y los acuerdos comerciales, se convierte en una cifra consistente y comparable entre juegos, mercados y periodos de tiempo.
Esa coherencia es la razón por la que GGR funciona como un lenguaje común en toda la industria:
- de telecomunicaciones Úselo para comparar el rendimiento de los juegos en diferentes títulos y mercados, aislando el rendimiento del producto independientemente de los costos.
- Reguladores En muchas jurisdicciones, se utiliza el GGR como base imponible para los impuestos sobre el juego, aunque el tratamiento exacto varía según el mercado, y los operadores siempre deben consultar los marcos normativos locales.
- Proveedores y proveedores de plataformas Por lo general, los acuerdos de reparto de ingresos y regalías se estructuran en torno a los ingresos brutos del juego (GGR), lo que proporciona a ambas partes una cifra clara y auditable con la que trabajar.
- Los programas de afiliados También pueden operar con modelos de comisión basados en GGR, aunque los acuerdos NGR son igualmente comunes dependiendo de lo que se acuerde en el contrato.
¿Qué son los ingresos netos por juegos de azar (NGR)?
NGR significa lo que queda después de deducir los costos directos del juego de los ingresos brutos del juego (GGR). Mientras que GGR mide cuánto ganaron los juegos, NGR se acerca más a los ingresos reales disponibles de la empresa antes de que entren en juego gastos más amplios como nómina, marketing y tecnología. No es una cifra de ganancias, pero es un indicador de ingresos más preciso que el GGR por sí solo.
No existe una fórmula universal para las deducciones de emisiones de gas natural. Las deducciones varían según el operador, la jurisdicción y el acuerdo comercial. Por ejemplo:
El operador A deduce: bonificaciones + impuesto sobre el juego → Ingresos brutos netos = $42,000
El operador B deduce: bonificaciones + impuesto sobre el juego + regalías del proveedor + comisiones de pago → NGR = $36,000
Mismo GGR ($60,000). Diferente NGR. Ambos son válidos; lo que difiere es el conjunto de deducciones.
El Reino Unido pone las apuestas en perspectiva. La Comisión de Juego del Reino Unido informó de un ingreso bruto por juego de 16.8 millones de libras esterlinas para el año que finaliza en marzo de 2025. , con un aumento del 7.3% interanual, de los cuales 7.8 millones de libras esterlinas corresponden al comercio electrónico. A esa escala, incluso una modesta diferencia porcentual entre los ingresos brutos del juego (GGR) y los ingresos brutos del juego (NGR) se traduce en ingresos significativos, razón por la cual es fundamental comprender ambas métricas.
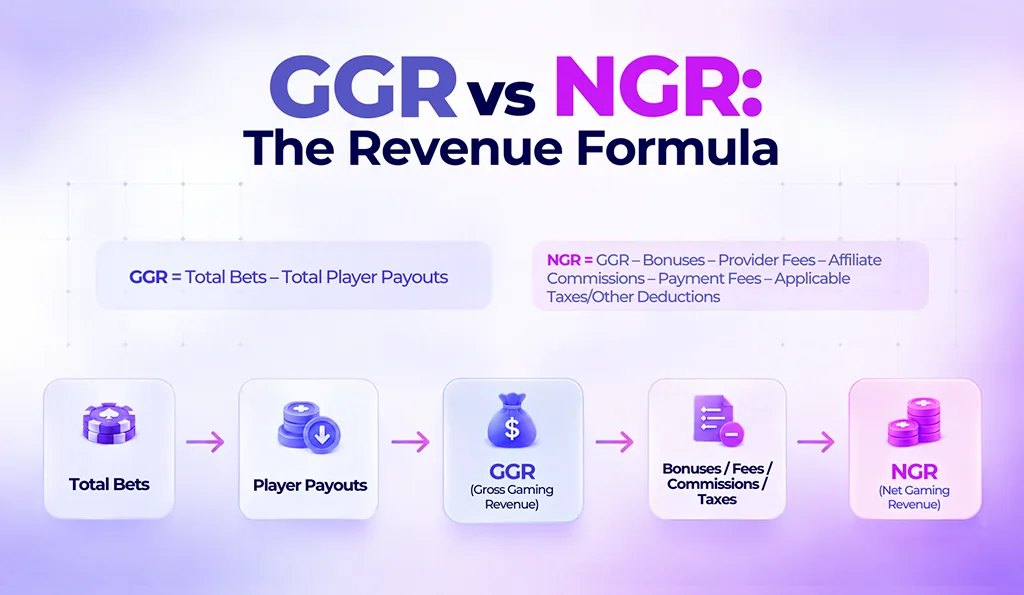
GGR vs NGR: La fórmula de los ingresos
GGR vs NGR: la comparación en cascada
GGR y NGR no compiten por las mismas métricas. Se sitúan en diferentes puntos de la misma cascada de ingresos, y analizarlas conjuntamente cuenta una historia que ninguna puede contar por sí sola.
La relación NGR/GGR es uno de los indicadores de margen más útiles que un operador puede monitorear. Si el GGR está creciendo, pero la relación se reduce, es probable que el negocio tenga un problema de estructura de costos en lugar de un problema de demanda. La brecha entre ambas métricas se está ampliando, y hay algo específico que la está impulsando:
- El mayor gasto en bonificaciones y promociones reduce los ingresos retenidos.
- Un mayor coste de adquisición de jugadores incrementa las deducciones relacionadas con el marketing.
- Incremento de las tarifas de regalías de los proveedores a medida que se renegocian los acuerdos comerciales.
- Ineficiencia en la pila de pagos o aumento de las devoluciones de cargo, lo que genera costos adicionales por fricción.
- Presión fiscal derivada de la expansión a nuevos mercados regulados con aranceles más elevados.
- Se observa un cambio en la composición de los jugadores hacia segmentos de menor margen, donde las deducciones son proporcionalmente mayores.
Para identificar cuál de estos factores es el responsable, es necesario ir más allá de las cifras principales, pero el movimiento de GGR a NGR es lo que, en primer lugar, indica que algo necesita atención.
| Factor | GGR | NGR |
|---|---|---|
| que mide | Rendimiento bruto del juego (apuestas – ganancias) | Ingresos después de deducciones definidas de los ingresos brutos gubernamentales |
| Punto de partida | Apuestas totales de los jugadores | GGR |
| ¿Se han descontado los pagos a los jugadores? | Sí (para calcular GGR) | Ya excluido en GGR |
| ¿Se descontaron las bonificaciones? | No | Sí (donde se haya acordado) |
| ¿Se dedujeron los costos del proveedor? | No | Sí (donde se haya acordado) |
| ¿Se dedujeron los costos de afiliación? | No | A veces (depende del contrato; a menudo se encuentra por debajo de NGR) |
| ¿Se dedujeron los gastos de pago? | No | Sí (donde se haya acordado) |
| ¿Impuestos deducidos? | No | Generalmente sí para las obligaciones relacionadas con los juegos de azar; el tratamiento exacto depende de la jurisdicción y del contrato. |
| Uso primario | Rendimiento de alto nivel y evaluación comparativa | Análisis de márgenes, economía unitaria y acuerdos comerciales |
Lo que realmente te indica la diferencia GGR/NGR: diagnóstico del operador
La diferencia entre GGR y NGR no es solo una cuestión contable. La forma en que ambas cifras varían entre sí apunta a problemas muy diferentes, y cada combinación requiere una respuesta distinta.
GGR es bajo + NGR es bajo
Este es un problema de generación de ingresos. Los jugadores no pierden lo suficiente en relación con las apuestas, lo que significa que la estructura de costos podría ser adecuada. El problema radica en un nivel superior.
Los operadores deben analizar el rendimiento de adquisición y retención de clientes, la variedad de juegos y la competitividad del producto en los mercados donde opera. La simple reducción de costos no solucionará el problema. Es necesario mejorar los ingresos.
GGR es alto + NGR es bajo
Se trata de un problema de ahorro de costes. Los ingresos llegan, pero se consumen antes de que reflejen los beneficios. Los juegos funcionan, pero las deducciones son demasiado elevadas.
La investigación debe centrarse en los términos y condiciones de las bonificaciones, las tasas de regalías de los proveedores, las tarifas de procesamiento de pagos, Comisiones de afiliados (dependiendo del contrato y del tratamiento de pérdidas y ganancias), y la carga tributaria total. Cada uno de estos se sitúa entre los ingresos brutos gubernamentales (GGR) y los ingresos netos gubernamentales (NGR), y es probable que uno o más estén por encima de lo que deberían.
La tasa de crecimiento bruto (GGR) está creciendo y la relación NGR/GGR está disminuyendo.
El crecimiento se está volviendo menos eficiente. El GGR avanza en la dirección correcta, pero el ratio indica que las deducciones crecen más rápido que los ingresos. La prioridad es identificar qué partida de deducciones se expande más rápidamente en relación con el GGR.
La expansión a nuevos mercados regulados es una de las causas más comunes, ya que los aranceles más elevados y los costes de cumplimiento tienden a reducir rápidamente la proporción a medida que crece la presencia en el mercado.
Tanto GGR como NGR están creciendo + la relación es estable
Esta es la combinación más saludable e indica una trayectoria de crecimiento que no está canibalizando sus propios márgenes. Dicho esto, la estabilidad de la relación aún puede enmascarar una compresión subyacente si la composición de los jugadores se está desplazando silenciosamente hacia segmentos de menor margen.
Los operadores deben supervisar la rentabilidad unitaria a gran escala y realizar un seguimiento de la NGR por mercado para detectar cualquier desviación a nivel de segmento antes de que afecte al ratio agregado.
¿Por qué está creciendo su GGR pero no su NGR?
Cuando las deducciones crecen más rápido que los ingresos brutos del juego, los ingresos brutos del juego (GGR) aumentan mientras que los ingresos brutos del juego (NGR) se estancan. Esta diferencia varía según el operador, el mercado y el contrato. Aquí le indicamos dónde buscar.
Abuso de bonos y promociones mal diseñadas
Los costos promocionales pueden comprimir rápidamente los ingresos netos brutos (NGR), especialmente cuando las ofertas no están bien dirigidas o son susceptibles de abuso. Analice por separado la emisión, el canje y el costo real de los bonos, en lugar de tratar el gasto en bonos como una sola partida.
Los requisitos de apuesta proporcionales, las reglas claras de contribución del juego y la segmentación del valor del jugador pueden mejorar la eficacia de las promociones. Todos los términos deben cumplir con las normativas locales de protección al consumidor y de marketing de juegos de azar. En Gran Bretaña, por ejemplo, los requisitos de apuesta no pueden superar diez veces el valor del juego, y los términos de los incentivos deben ser claros, transparentes y justos.
Dependencia excesiva de contenido de juegos de alto costo
El contenido premium o de alta demanda puede implicar tarifas de proveedor más altas, tasas de participación en los ingresos, garantías mínimas o contribuciones al premio mayor que erosionan silenciosamente los ingresos de nueva generación a gran escala. Analizar el coste efectivo de cada proveedor y título, y comparar las integraciones directas con los acuerdos de agregación, puede revelar de dónde proviene la mayor presión.
Agregadores de juegos Pueden mejorar la eficiencia del acceso y la integración, pero sus tarifas y condiciones contractuales deben incluirse en cualquier comparación de costos, en lugar de asumir que son automáticamente más baratos.
Ineficiencia en la pila de pagos
Las comisiones de procesamiento, el enrutamiento deficiente, las pérdidas por fraude y las devoluciones de cargo pueden reducir el monto retenido después de la actividad de juego. El punto de partida es analizar las tasas de aprobación, el costo efectivo de las transacciones y el rendimiento de las devoluciones de cargo por mercado y método de pago.
Local Métodos de pago Un enrutamiento más inteligente podría ayudar a cerrar la brecha, pero el resultado depende de los precios, el riesgo y las condiciones de liquidación específicas de cada mercado.
Impuestos jurisdiccionales y costos de licencias
La expansión de un mercado regulado puede implicar impuestos sobre el juego, tasas de licencia, gastos de cumplimiento normativo y requisitos de información, si bien la estructura y la magnitud varían según la jurisdicción. Los operadores más expuestos están basando su entrada al mercado en proyecciones de ingresos brutos del juego (GGR) sin tener en cuenta las estructuras impositivas locales.
Elaborar un modelo específico para cada mercado antes del lanzamiento, donde los ingresos brutos del juego, los costos de promoción, los impuestos, los costos de pago, los cargos de los proveedores y los costos de cumplimiento se desglosan por separado, ofrece una imagen realista de lo que realmente generará cada mercado.
GGR frente a NGR en acuerdos de afiliación y reparto de ingresos
La distinción entre GGR y NGR es crucial en los acuerdos de afiliación. Una fórmula de comisión poco clara puede generar disputas y reducir la rentabilidad esperada de ambas partes, especialmente durante periodos de intensa promoción o al ingresar a mercados con impuestos más altos. Dado que la definición de NGR no es la misma en todos los programas, acordar el método de cálculo antes de firmar resulta considerablemente más económico que resolver disputas posteriormente.
¿Por qué los operadores y afiliados pueden preferir modelos diferentes?
Los operadores y los afiliados suelen tener prioridades diferentes a la hora de negociar la base de comisiones, aunque ninguna de las dos preferencias es universal.
Las empresas afiliadas suelen preferir los acuerdos basados en GGR porque este suele implicar menos deducciones y es más fácil de predecir. Sin embargo, un acuerdo basado en NGR claramente definido también puede resultar atractivo si la lista de deducciones es reducida, transparente y auditable. Lo que dificulta la predicción de los acuerdos NGR son las deducciones amplias o sin límite, no la métrica en sí.
Los operadores suelen preferir los acuerdos basados en NGR porque este modelo puede tener en cuenta los costes directos acordados, como los gastos de promoción, los impuestos sobre el juego, las comisiones por pago y las devoluciones de cargo confirmadas.
Esto reduce el riesgo de pagar comisiones sobre ingresos que ya han sido consumidos por esos costos. El resultado comercial real depende de la tasa de comisión y de las deducciones específicas que permite el acuerdo.
Cómo los operadores deben realizar un seguimiento de los ingresos brutos del juego (GGR) y los ingresos brutos del casino (NGR) en todo su casino.
Los indicadores agregados de ingresos brutos y netos son útiles para medir los ingresos totales, pero pueden ocultar dónde se está generando presión sobre los márgenes. El valor reside en el desglose, y este requiere definiciones de deducción consistentes antes de crear cualquier panel de control o informe basado en él.
Seguimiento por mercado y jurisdicción
Los ingresos brutos del juego (GGR) y los ingresos netos del juego (NGR) deben reportarse por país, moneda, marca y licencia desde su lanzamiento. Un mercado que contribuye significativamente a los GGR puede generar NGR sustancialmente menor una vez aplicadas las deducciones del modelo del operador, ya sean bonificaciones, impuestos sobre el juego, costos de pago u otros cargos acordados.
Informar por separado sobre los costos de impuestos, aranceles y regulaciones, junto con cualquier análisis de NGR, ofrece una imagen más clara tanto del cálculo como del costo subyacente que genera la diferencia.
Seguimiento del rendimiento por juego y proveedor
A nivel de juego, proveedor y agregador, los operadores deben supervisar las apuestas, los ingresos brutos del juego (GGR), el coste de los bonos, las comisiones del proveedor, la contribución tras los costes directos del juego y la relación ingresos netos del juego (NGR)/ingresos brutos del juego (GGR).
Proveedores de juegos Los cargos pueden estructurarse como participación en los ingresos, tarifas fijas, garantías mínimas o contratos a nivel de cartera, por lo que el método de asignación debe documentarse en lugar de asumirse. Unos ingresos brutos globales (GGR) elevados de un título no implican automáticamente una contribución significativa si los costes de los proveedores o de promoción son altos.
Seguimiento de la economía de adquisiciones de principio a fin
La comercialización del afiliado Los datos deben estar vinculados desde el clic o la campaña hasta el registro, el primer depósito, las apuestas, el GGR y el NGR acordado.
Un canal que genera un alto GGR aún puede producir contribuciones débiles o negativas después de aplicar los costos de promoción y adquisición. El uso de definiciones consistentes de jugadores, cohortes, zonas horarias y monedas en todos los sistemas es lo que hace que esta perspectiva sea confiable en lugar de meramente indicativa.
Establecer umbrales internos para las alertas de la relación NGR/GGR.
Las alertas casi en tiempo real pueden ayudar a identificar cambios importantes en la relación NGR/GGR antes de que se acumulen a lo largo de un período de informe completo, pero el resultado debe tratarse como provisional hasta que se registren los costos y ajustes diferidos.
Una caída de cinco puntos porcentuales en un período de siete días es un umbral inicial interno razonable, no un referente del sector. Las alertas deben calibrarse según el mercado, el producto, el grupo demográfico y la volatilidad histórica, aplicando umbrales de volumen mínimo para evitar reaccionar ante muestras pequeñas.
Conciliar todas las fuentes de información
Software de casino en línea Los datos, los informes de los proveedores, los datos de los procesadores de pagos y los datos de las plataformas de afiliados deben conciliarse según un calendario definido, utilizando períodos de informe, zonas horarias, monedas y definiciones de métricas consistentes.
Las diferencias entre las fuentes no siempre se explican por deducciones. También pueden reflejar eventos faltantes, registros duplicados, errores de atribución, contracargos tardíos, apuestas anuladas, conversión de divisas o retrasos en la liquidación. Identificar la causa antes de sacar conclusiones es lo que distingue una conciliación útil del ruido.
Conclusión
GGR te indica el rendimiento de los juegos. NGR te muestra las ganancias reales de la empresa. Analizar uno sin el otro deja puntos ciegos que se acumulan silenciosamente con el tiempo.
Ya sea que esté estructurando acuerdos de afiliación, ingresando a nuevos mercados o revisando los costos de los proveedores, la diferencia entre los ingresos brutos del gobierno (GGR) y los ingresos netos del gobierno (NGR) es donde se gana o se pierde margen. Sepa qué la impulsa, monitoréela por segmento y actúe antes de que afecte sus resultados.

Contáctenos
Preguntas Frecuentes
-
¿Qué es el GGR en el sector del juego y cómo se calcula el GGR para un casino online?
Los ingresos brutos por juego (GGR, por sus siglas en inglés) son la cantidad que un casino retiene después de pagar las ganancias de los jugadores. La fórmula es sencilla: GGR = apuestas totales menos pagos totales. En esta etapa no se deducen bonos, impuestos ni gastos operativos. Es una medida del rendimiento del juego, no de las ganancias.
-
GGR vs NGR: ¿Cuál es la diferencia real?
GGR mide los ingresos antes de aplicar cualquier deducción. NGR es lo que queda después de aplicar las deducciones acordadas, como bonificaciones, impuestos, comisiones por pago y comisiones de afiliados. GGR indica el rendimiento de los juegos. NGR indica lo que la empresa realmente se quedó.
-
¿Cómo se relacionan los ingresos brutos del juego (GGR) y los ingresos brutos del casino (NGR) con la rentabilidad de los casinos?
El GGR refleja los ingresos generados por la actividad de los jugadores. El NGR muestra lo que queda después de deducir los costos directos del juego. En conjunto, ofrecen a los operadores una visión más clara de los márgenes, la eficiencia del marketing y dónde los costos ejercen presión antes de que entren en juego los gastos operativos generales.
-
¿Qué es NGR en el mundo de los juegos y cómo se calcula el NGR para un casino en línea?
Los ingresos netos por juego (NGR, por sus siglas en inglés) son los ingresos brutos del juego (GGR, por sus siglas en inglés) después de aplicar las deducciones acordadas. La fórmula es: NGR = GGR menos bonos, impuestos, comisiones por pago y cualquier otro costo permitido definido en la política contable del operador o en los acuerdos comerciales. El conjunto exacto de deducciones varía según el operador, la jurisdicción y el contrato.
-
¿Por qué un casino en línea realiza un seguimiento tanto de los ingresos brutos del juego (GGR) como de los ingresos brutos del casino (NGR)?
GGR mide el rendimiento de los juegos. NGR mide qué porcentaje de ese rendimiento retiene realmente la empresa. El seguimiento conjunto de ambos indicadores permite identificar dónde aumentan las deducciones, dónde se incrementa la presión sobre los márgenes y si el crecimiento se traduce en ingresos con los que el operador pueda trabajar.


Palak Madan lleva escribiendo sobre la industria del iGaming desde 2024. Se centra en ayudar a operadores y fundadores a comprender sus opciones al lanzar un casino online, desde elegir el proveedor de software adecuado hasta calcular los costes y los requisitos de cumplimiento en diferentes mercados. PieGamingEn sus escritos, aborda temas como soluciones de casino de marca blanca, selección de plataformas y entrada al mercado, transformando información compleja del sector en consejos prácticos para quienes desarrollan negocios de iGaming. Además, sigue de cerca los cambios en las licencias y la normativa, en particular cómo las nuevas reglas influyen en la forma en que los operadores entran y crecen en diferentes jurisdicciones.

Iniciar un casino en línea llave en mano implica obtener una plataforma lista para usar con software prediseñado y juegos preintegrados, pero personalizándola según tus preferencias. Los pasos clave incluyen investigar el mercado, definir un presupuesto, seleccionar socios, obtener una licencia de juego, configurar los métodos de pago y mucho más.

Los problemas en los casinos online pueden afectar a los operadores en todas las etapas, desde la entrada al mercado y los pagos hasta la fidelización de jugadores, la tecnología y la rentabilidad. Descubra los principales desafíos y las soluciones prácticas para abordarlos.

Kenia cuenta con un mercado de juegos de azar en línea en auge, impulsado por la creciente adopción de internet y los sistemas de pago móvil. Esta guía explica los pasos y protocolos necesarios para establecer un casino en línea en Kenia, incluyendo la normativa y los requisitos de licencia.

Los componentes clave para aumentar la base de usuarios de un casino online se resumen en cuatro áreas: los canales de adquisición adecuados, la interacción personalizada, el desarrollo de programas de fidelización y la toma de decisiones basada en datos. Crear una experiencia móvil, mantener el interés de los jugadores y adaptar la estrategia a los mercados que se desean atraer son igualmente cruciales para un crecimiento sostenible.

Este blog analiza las estrategias clave de los principales operadores de iGaming en 2026 y cómo puedes crecer como ellos y convertirte en líder del mercado. No te lo pierdas.

Abrir un casino en línea suena emocionante. Pero muchos operadores nuevos fracasan a los pocos meses debido a errores inevitables. Aquí tienes los 10 errores principales que debes evitar.

Aprenda cómo iniciar un casino en línea en Turquía en 2026. Obtenga consejos sencillos sobre leyes, licencias, pagos y más para gestionar su negocio sin problemas.

¡Nos vemos pronto en tu bandeja de entrada!

Manténgase a la vanguardia del juego. Suscríbete para exclusivo
¡Contenido, actualizaciones y información privilegiada!