
Le GGR (revenu brut des jeux) et le NGR (revenu net des jeux) sont deux indicateurs de revenus essentiels que tout opérateur de casino doit suivre. Le GGR correspond au total des mises moins les paiements aux joueurs, reflétant ainsi la performance du jeu avant toute déduction. Le NGR est le GGR après déduction des bonus, taxes, frais de paiement, redevances des fournisseurs et rétrofacturations. L'écart entre les deux révèle les zones de pression sur les marges.

Your casino posts $60,000 in GGR for the month, but its NGR may land $25,000 lower once bonuses, gaming taxes, payment fees, chargebacks, jackpot contributions, and supplier costs are deducted.
GGR is a core headline metric, but it doesn’t show what the business has available to cover operating costs or generate profit. U.S. commercial gaming generated $78.72B in GGR in 2025, yet that Indicateurs clés de performance (KPI) du casino alone says nothing about operator profitability. This piece explains what each metric means, how to calculate them, and what a widening gap between the two may signal.
What is GGR (Gross Gaming Revenue)?
GGR meaning is the amount a casino retains after paying out player winnings. If players collectively wager $1,000,000 and walk away with $940,000 in payouts, the operator keeps $60,000. That $60,000 is the GGR.
| Métrique | Montant |
| Total des mises | €1,000,000 |
| Player payouts | €940,000 |
| GGR | €60,000 |
It is the standard measure of gaming performance, not a measure of profit. GGR tells you how much the game won, not how much the business made.
The calculation only accounts for two things: total player wagers placed, and total player payouts subtracted from those wagers. Everything else sits outside the GGR. The following costs are not deducted at this stage:
- Bonus costs.
- Frais de traitement des paiements.
- Commissions d'affiliation.
- Provider fees and royalties.
- Taxes and licensing costs.
- Remboursements.
All of those come out later, either at the NGR stage or further down the P&L. That separation is actually what makes GGR useful. Because it strips out cost structures and commercial arrangements, it becomes a consistent, comparable number across games, markets, and time periods.
That consistency is why GGR functions as a common language across the industry:
- Les opérateurs use it to benchmark gaming performance across games and markets, isolating product performance independently of costs.
- Régulateurs use GGR as the tax base for gaming duties in many jurisdictions, though the exact treatment varies by market, and operators should always refer to local frameworks.
- Fournisseurs et fournisseurs de plate-forme typically structure revenue-share and royalty agreements around GGR, giving both sides a clean, auditable number to work from.
- Les programmes d'affiliation may also operate on GGR-based commission models, though NGR deals are equally common depending on what’s agreed in the contract.
What is Net Gaming Revenue (NGR)?
NGR meaning what remains after direct gaming costs are deducted from GGR. Where GGR measures how much the games won, NGR gets closer to what the business actually has available before broader expenses like payroll, marketing, and technology come into play. It is not a profit figure, but it is a more honest revenue number than GGR alone.
There is no universal NGR formula. Deductions vary by operator, jurisdiction, and commercial agreement. For instance
Operator A deducts: bonuses + gaming tax → NGR = $42,000
Operator B deducts: bonuses + gaming tax + provider royalties + payment fees → NGR = $36,000
Same GGR ($60,000). Different NGR. Both are valid — the deduction set is what differs.
The UK puts the stakes into perspective. The UK Gambling Commission reported gross gambling yield of £16.8 billion for the year to March 2025 , up 7.3% year on year, with online accounting for £7.8 billion. At that scale, even a modest percentage difference between GGR and NGR translates into significant revenue, which is exactly why understanding both metrics matters.
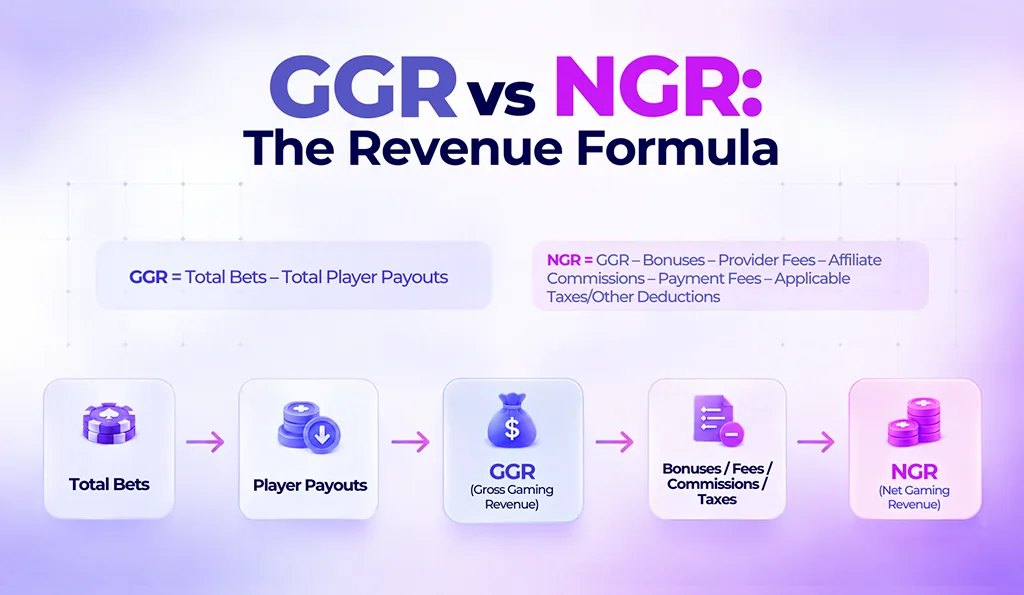
GGR vs NGR: The Revenue Formula
GGR vs NGR — The Waterfall Comparison
GGR and NGR are not competing for metrics. They sit at different points in the same revenue waterfall, and reading them together tells a story that neither can tell alone.
The NGR/GGR ratio is one of the more useful margin health indicators an operator can track. If GGR is growing but the ratio is narrowing, the business likely has a cost-structure problem rather than a top-line demand problem. The gap between the two metrics is widening, and something specific is driving it:
- Higher bonus and promotional spend eating into retained revenue.
- More expensive player acquisition pushes up marketing-related deductions.
- Increasing provider royalty rates as commercial agreements are renegotiated.
- Payment stack inefficiency or chargeback growth, adding friction costs.
- Tax pressure from scaling into new regulated markets with higher duty rates.
- A shift in player mixes toward lower-margin segments where deductions are proportionally heavier.
Identifying which of these is responsible requires looking beyond the headline numbers, but the GGR-to-NGR movement is what flags that something needs attention in the first place.
| Facteur | GGR | NGR |
|---|---|---|
| Ce qu'il mesure | Gross gaming performance (stakes – winnings) | Revenue after defined deductions from GGR |
| Point de départ | Total player wagers | GGR |
| Player payouts deducted? | Yes (to calculate GGR) | Already excluded in GGR |
| Bonuses deducted? | Non | Yes (where agreed) |
| Provider costs deducted? | Non | Yes (where agreed) |
| Affiliate costs deducted? | Non | Sometimes (depends on contract; often sits below NGR) |
| Payment costs deducted? | Non | Yes (where agreed) |
| Taxes deducted? | Non | Usually yes for gaming duties; exact treatment jurisdiction- and contract-dependent |
| Utilisation principale | Top-line performance and benchmarking | Margin analysis, unit economics, and commercial deals |
What the GGR/NGR Gap Actually Tells You — Operator Diagnostics
The gap between GGR and NGR is not just an accounting difference. The way the two numbers move relative to each other points to very different problems, and each combination calls for a different response.
GGR Is Low + NGR Is Low
This is a revenue generation problem. Players are not losing enough to the house relative to stakes, which means the cost structure may actually be fine. The issue sits higher up.
Operators should investigate acquisition and retention performance, game mix, and whether the product is competitive in the markets it is operating in. Pure cost-cutting alone will not fix this. The top line needs work.
GGR Is High + NGR Is Low
This is a cost-saving problem. Revenue is arriving but being consumed before it reaches the bottom line. The games are performing, but the deductions are too heavy.
The investigation should focus on bonus terms and conditions, provider royalty rates, payment processing fees, commissions d'affiliation (depending on contract and P&L treatment), and overall tax load. Each of these sits between GGR and NGR, and one or more is likely running ahead of where it should be.
GGR Is Growing + NGR/GGR Ratio Is Falling
Growth is becoming less efficient. GGR is moving in the right direction, but the ratio tells you that deductions are growing faster than revenue. The priority is identifying which deduction line is expanding fastest relative to GGR.
Scaling into new regulated markets is one of the most common causes, since higher duty rates and compliance costs tend to compress the ratio quickly as market footprint grows.
GGR and NGR Are Both Growing + Ratio Is Stable
This is the healthiest combination and signals a growth trajectory that is not cannibalizing its own margins. That said, ratio stability can still mask underlying compression if player mix is shifting quietly toward lower-margin segments.
Operators should monitor unit economics at scale and track NGR on a per-market basis to catch any segment-level drift before it moves the aggregate ratio.
Why is Your GGR Growing but Your NGR Isn’t?
When deductions grow faster than gross gaming revenue, GGR rises while NGR stagnates. The gap varies by operator, market, and contract. Here is where to look.
Bonus Abuse and Poorly Designed Promotions
Promotional costs can compress NGR quickly, particularly when offers are poorly targeted or vulnerable to abuse. Review bonus issuance, redemption, and realized cost separately rather than treating bonus spend as a single line.
Proportionate wagering requirements, clear game-contribution rules, and player-value segmentation can all improve promotional efficiency. All terms must comply with local consumer protection and gambling marketing requirements. In Great Britain, for example, wagering requirements cannot exceed ten times, and incentive terms must be clear, transparent, and fair.
Over-Reliance on High-Cost Game Content
Premium or high-demand content may involve higher supplier fees, revenue-share rates, minimum guarantees, or jackpot contributions that quietly erode NGR at scale. Reviewing the effective cost of each provider and title, and comparing direct integrations against aggregator arrangements, can surface where the heaviest pressure is coming from.
Agrégateurs de jeux may improve access and integration efficiency, but their fees and contractual terms should be included in any cost comparison rather than assumed to be automatically cheaper.
Payment Stack Inefficiency
Processing fees, poor routing, fraud losses, and chargebacks can reduce the amount retained after gaming activity. Reviewing approval rates, effective transaction cost, and chargeback performance by market and payment method is the starting point.
Fournisseurs Moyens de paiement and smarter routing may help close the gap, but the outcome depends on the pricing, risk, and settlement terms specific to each market.
Jurisdictional Tax and Licensing Costs
Regulated market expansion can add gaming duties, license fees, compliance expenses, and reporting requirements, though the structure and scale vary by jurisdiction. Operators most exposed are modelling market entry on GGR projections without accounting for local tax structures.
Building a market-specific model before launching, with GGR, promotional costs, taxes, payment costs, supplier charges, and compliance costs mapped separately, gives a realistic picture of what each market will actually return.
GGR vs NGR in Affiliate and Revenue-Share Deals
The GGR/NGR distinction matters significantly in affiliate agreements. An unclear commission formula can create disputes and reduce either party’s expected return, particularly during heavy promotional periods or when entering higher-tax markets. Because NGR is not defined identically across all programmes, agreeing with the calculation method before signing is considerably cheaper than resolving disputes after settlement.
Why Operators and Affiliates May Prefer Different Models
Operators and affiliates often have different priorities when negotiating the commission base, though neither preference is universal.
Affiliates often favor GGR-based deals because GGR typically carries fewer deductions and is easier to forecast. That said, a clearly defined NGR deal can also be attractive if the deduction list is narrow, transparent, and auditable. Broad or uncapped deductions are what make NGR deals difficult to predict, not the metric itself.
Operators often favor NGR-based deals because the model can account for agreed direct costs such as promotional spend, gaming taxes, payment fees, and confirmed chargebacks.
This reduces the risk of paying commissions on revenue that has already been consumed by those costs. The actual commercial outcome depends on the commission rate and the specific deductions the agreement permits.
How Operators Should Track GGR and NGR Across Their Casino
Aggregate GGR and NGR are useful for top-line measures, but they can conceal where margin pressure is developing. The value is in the breakdown, and that breakdown needs consistent deduction definitions before any dashboard or report is built around it.
Track by Market and Jurisdiction
GGR and NGR should be reported by country, currency, brand, and licence from launch. A market contributing to a large share of GGR may deliver substantially less NGR once the deductions in the operator model are applied, whether those are bonuses, gaming taxes, payment costs, or other agreed charges.
Reporting tax, duty, and regulatory costs separately alongside any NGR view gives a clearer picture of both the calculation and the underlying cost driving the gap.
Track Performance by Game and Provider
At game, provider, and aggregator level, operators should monitor wagers, GGR, bonus cost, provider charges, contribution after direct gaming costs, and the NGR/GGR ratio.
Fournisseurs de jeux charge may be structured as revenue share, fixed fees, minimum guarantees, or portfolio-level contracts, so the allocation method should be documented rather than assumed. Strong GGR from a title does not automatically mean strong contribution if supplier or promotional costs are running high against it.
Track Acquisition Economics End to End
Le marketing d'affiliation data should be linked from click or campaign through to registration, first deposit, wagering, GGR, and agreed NGR.
A channel generating strong GGR can still produce weak or negative contributions after promotional and acquisition costs are applied. Using consistent player, cohort, time-zone, and currency definitions across systems is what makes this view reliable rather than directional.
Set Internal Thresholds for NGR/GGR Ratio Alerts
Near-real-time alerts can help identify material shifts in the NGR/GGR ratio before they compound across a full reporting period, but the result should be treated as provisional until delayed costs and adjustments are posted.
A five-percentage-point drop over a seven-day window is a reasonable internal starting threshold, not an industry benchmark. Alerts should be calibrated by market, product, cohort, and historical volatility, with minimum volume thresholds applied to avoid reacting to small samples.
Reconcile Every Reporting Source
Logiciel de casino en ligne data, provider reports, payment processor data, and affiliate platform data should be reconciled on a defined schedule using consistent reporting periods, time zones, currencies, and metric definitions.
Differences between sources are not always unexplained by deductions. They can also reflect missing events, duplicate records, attribution errors, late chargebacks, voided bets, currency conversion, or settlement timing. Identifying the cause before drawing conclusions is what separates useful reconciliation from noise.
Emballer…
GGR tells you how the games are performing. NGR tells you what the business actually keeps. Tracking one without the other leaves blind spots that quietly compound over time.
Whether you are structuring affiliate deals, entering new markets, or reviewing provider costs, the GGR vs NGR gap is where margin is won or lost. Know what is driving it, monitor it by segment, and act before it moves to the bottom line.

Contactez-Nous
FAQ
-
What is GGR in gaming and how do you calculate GGR for an online casino?
Gross Gaming Revenue (GGR) is the amount a casino retains after paying out player winnings. The formula is straightforward: GGR = total wagers minus total payouts. No bonuses, taxes, or operating costs are deducted at this stage. It is a measure of gaming performance, not profit.
-
GGR vs NGR: What is the actual difference?
GGR measures revenue before any deductions are applied. NGR is what remains after agreed deductions such as bonuses, taxes, payment fees, and affiliate commissions are taken out. GGR tells you how the games are performed. NGR tells you what the business actually kept.
-
How are GGR and NGR connected to casino profitability?
GGR reflects the revenue generated by player activity. NGR shows what remains after direct gaming costs are deducted. Together, they give operators a clearer view of margins, marketing efficiency, and where costs are applying pressure before broader operating expenses enter the picture.
-
What is NGR in gaming and how do you calculate NGR for an online casino?
Net Gaming Revenue (NGR) is GGR after agreed deductions have been applied. The formula is: NGR = GGR minus bonuses, taxes, payment fees, and any other permitted costs defined in the operator's accounting policy or commercial agreements. The exact deduction set varies by operator, jurisdiction, and contract.
-
Why does an online casino track both GGR and NGR?
GGR measures how well the games are performing. NGR measures how much of that performance the business actually retains. Tracking both together highlights where deductions are growing, where margin pressure is building, and whether growth is translating into revenue the operator can actually work with.


Palak Madan écrit sur l'industrie du jeu en ligne depuis 2024. Elle s'attache à aider les opérateurs et les fondateurs à comprendre leurs options lors du lancement d'un casino en ligne, du choix du bon fournisseur de logiciels à l'évaluation des coûts et des exigences de conformité sur les différents marchés. PieGamingElle aborde des sujets tels que les solutions de casino en marque blanche, le choix de plateformes et l'entrée sur le marché, transformant des informations complexes du secteur en conseils pratiques pour les personnes qui créent des entreprises de jeux en ligne. Elle suit également de près les évolutions en matière de licences et de réglementation, notamment la manière dont les nouvelles règles influencent l'entrée et le développement des opérateurs dans différentes juridictions.

Les casinos en ligne ont acquis une popularité considérable, et leurs revenus mondiaux devraient passer d'environ 19.1 milliards de dollars en 2024 à 38 milliards de dollars d'ici 2030, selon les prévisions. Grand View Research Ce rapport met en lumière de sérieux problèmes pour les opérateurs de casinos en ligne. Ce guide détaille les principaux défis auxquels ils sont confrontés.

Le Kenya connaît une croissance fulgurante de son marché des jeux d'argent en ligne, portée par l'essor d'Internet et des systèmes de paiement mobile. Ce guide détaille les étapes et les procédures à suivre pour créer un casino en ligne au Kenya, notamment la réglementation et les exigences en matière de licences.

Les éléments clés pour développer le nombre d'utilisateurs de casinos en ligne se résument à quatre axes : le choix des bons canaux d'acquisition, la personnalisation de l'expérience client, le développement de programmes de fidélité et la prise de décisions basées sur les données. Créer une expérience mobile optimale, fidéliser les joueurs et adapter votre stratégie aux marchés cibles sont tout aussi essentiels à une croissance durable.

Ce blog présente les stratégies clés des principaux opérateurs de jeux en ligne en 2026 et comment vous pouvez, comme eux, devenir un leader du marché. Restez connectés jusqu'à la fin.

Créer un casino en ligne semble prometteur. Mais de nombreux nouveaux opérateurs échouent en quelques mois à cause d'erreurs inévitables. Voici les 10 principales erreurs à éviter.

Apprenez à démarrer un casino en ligne en Turquie en 2026. Obtenez des conseils simples sur les lois, les licences, les paiements et plus encore pour gérer votre entreprise en douceur.

Pour lancer un casino en ligne en Espagne, il faut obtenir une licence auprès de l'autorité nationale de régulation des jeux, établir une présence locale et adapter le contenu, notamment les jeux et les méthodes de paiement, au marché local.

À bientôt dans votre boîte de réception !

Gardez une longueur d'avance. Abonnez-vous en exclusivité
contenu, mises à jour et initiés !

